
10 Metrics to Track with Real-Time Messaging Analytics
Real-time messaging analytics helps businesses monitor live customer interactions across SMS, email, and social media to improve response times, resolve issues faster, and drive better results. Tracking the right metrics ensures you can adjust campaigns, staffing, and processes instantly to meet customer expectations and boost revenue.
Here are the 10 key metrics you should focus on:
- Response Time: Measures how quickly your team replies to messages. Faster responses improve satisfaction and reduce lost opportunities.
- Resolution Time: Tracks how long it takes to fully resolve an issue. Shorter times mean happier customers and lower costs.
- First Contact Resolution (FCR): Shows how many issues are resolved in a single interaction. Higher rates indicate smoother workflows and better customer experiences.
- Message Delivery Rate: Ensures your messages reach recipients. Poor delivery rates can harm trust and revenue.
- Engagement Rate: Measures how many recipients interact with your messages (e.g., replies, clicks). Higher engagement leads to stronger customer connections.
- Response Rate: Tracks how often recipients reply to your messages. Indicates how well your communication resonates.
- Click-Through Rate (CTR): Shows how effective your messages are at driving clicks on links. A key metric for marketing ROI.
- Conversion Rate: Measures how many recipients take desired actions like purchases or bookings. Directly tied to revenue growth.
- Opt-In, Opt-Out, and List Health: Monitors audience growth and engagement. A healthy list ensures better results and compliance.
- Sentiment and Quality of Experience: Tracks customer feelings during interactions to identify and address problems in real time.
Why these metrics matter: They directly impact customer satisfaction, operational efficiency, and revenue. For example, faster response times can prevent customer churn, and higher CTRs can increase sales. Tools like Inbox Agents simplify tracking by consolidating all messaging channels into one dashboard.
Start by focusing on a few core metrics - like response time, resolution time, and conversion rate - and use real-time insights to make immediate improvements. Tracking these metrics ensures better customer experiences and measurable business outcomes.
10 Real-Time Messaging Metrics: Benchmarks and Impact Comparison
Textdrip Analytics Dashboard: See Every SMS Metric in Real Time!

1. Response Time
Response time is all about how quickly your team replies to incoming messages. It starts ticking the moment a customer sends their first message and stops when they get a response. This includes any delays caused by routing, queueing, or assigning the message to an agent. Most teams focus on first response time (FRT) as the key metric, often using the median instead of the average. Why? Because the median gives a clearer picture of what most customers experience, without being skewed by a few outliers with unusually long wait times. This metric is crucial for understanding how response delays affect both customer satisfaction and team performance.
Customer Experience Impact
In real-time messaging, speed is everything. Customers expect quick replies - over 80% for general support and a whopping 90% for sales inquiries. If they don’t get a timely response, they might leave the conversation altogether. For instance, if your median FRT starts creeping up during busy times, you risk losing frustrated customers who may abandon their inquiries or take their business elsewhere.
Operational Efficiency
Good response times are often a sign of a well-oiled team. By analyzing FRT by time of day, individual agents, or conversation types, you can identify bottlenecks and make adjustments. For example, if your queue consistently spikes every weekday at 2:00 PM and response times double, it’s a clear sign you might need more agents during that time slot. Tools like Inbox Agents (https://inboxagents.ai) can help streamline workflows by combining all messaging channels into one platform. With features like AI-powered summaries and smart reply suggestions, these tools allow agents to respond faster, cutting down both median and maximum wait times without adding extra staff.
Revenue Contribution
Quick responses aren’t just good for customer satisfaction - they’re also great for your bottom line. In sales, every minute of delay increases the chance that a high-intent lead will lose interest and move on. To see the impact, compare conversion rates for sales chats with sub-30-second FRTs versus those with waits of 2 minutes or more. For SMS, tracking response rates within specific windows (like 15 minutes or 1 hour) can help fine-tune follow-ups and boost conversions. Even small gains in response time can make a noticeable difference in conversion rates, making it worth investing in better routing, AI tools, or additional staffing.
2. Resolution Time
Resolution time refers to the total time it takes to resolve a customer's issue, starting from their initial message and including every back-and-forth interaction and delay along the way. Unlike response time, which focuses on how quickly an agent replies, resolution time paints a broader picture of the entire process. Many teams monitor both the average and median resolution times to get a clearer sense of what customers typically experience.
Customer Experience Impact
Resolution time plays a key role in shaping customer satisfaction, especially in real-time support scenarios. According to Help Scout, up to one-third of negative CSAT scores are directly linked to slow response or resolution times. When customers use messaging platforms, they expect quick, live responses rather than the delays often associated with email. If resolution drags on too long, it can lead to frustration, a breakdown in trust, or even customers abandoning the interaction altogether.
Understanding how resolution time affects customer experience highlights the importance of streamlining internal processes.
Operational Efficiency
Analyzing resolution time across different channels, issue types, agents, and even times of day can uncover operational bottlenecks. Challenges like repeated queue transfers, redundant consultations, or disjointed tools often slow down the resolution process. Real-time analytics can pinpoint trends - like resolution times spiking during peak hours or specific issue categories taking longer than average - that suggest areas needing better documentation or more agent training. Tools such as Inbox Agents (https://inboxagents.ai) simplify this process by consolidating all messaging channels (SMS, chat, WhatsApp, social DMs) into one platform. With AI-powered summaries and smart replies, agents can resolve issues more efficiently without juggling multiple tools.
Revenue Contribution
Quick resolution times don’t just keep customers happy - they also directly impact revenue. In sales, even a brief delay can mean losing high-intent leads. In support, faster resolutions allow agents to handle more cases in less time, cutting costs while boosting satisfaction. For subscription-based businesses, where customer loyalty and lifetime value are critical, consistently short resolution times can reduce churn and encourage repeat purchases. This makes resolution time a key metric for both operational and financial success.
3. First Contact Resolution Rate
When it comes to measuring support efficiency, First Contact Resolution (FCR) is a key metric. It tracks the percentage of customer issues resolved during their first interaction with support teams. The formula is straightforward: divide the number of issues resolved on the first contact by the total number of conversations, then multiply by 100. Most service teams aim for an FCR rate of 70–80%, although straightforward tasks like password resets or tracking orders often hit 80–85% or higher.
Customer Experience Impact
A high FCR score is a strong indicator of customer satisfaction. Why? Because it spares customers the frustration of repeating their problems or waiting for follow-ups. Real-time communication channels like SMS, WhatsApp, and live chat naturally support higher FCR since agents can quickly clarify and resolve issues on the spot. To ensure your FCR is truly effective, keep an eye on related metrics like CSAT scores and repeat-contact rates within 24–72 hours.
But the benefits of FCR go beyond just happy customers - it also streamlines workflows.
Operational Efficiency
Boosting FCR means fewer follow-up interactions, which lightens the overall workload. This allows agents to handle more cases without overwhelming the system, keeping queues under control. By analyzing FCR by issue type and communication channel, you can pinpoint areas where agents might need additional training. For example, billing inquiries often require multiple contacts, signaling a need for better preparation. Tools like Inbox Agents (https://inboxagents.ai) can help by centralizing messaging platforms and using AI to provide context, making it easier to resolve issues on the first try.
Revenue Contribution
Resolving issues quickly and completely doesn’t just make customers happy - it also protects and grows revenue. For subscription-based businesses, high FCR rates reduce churn by keeping customers satisfied and loyal. In sales scenarios, resolving product questions during the first interaction removes obstacles, often leading to higher conversion rates. Plus, when customers experience efficient support, they’re more open to cross-sell and upsell opportunities. By linking FCR data to metrics like repeat purchase rates and subscription renewals, businesses can clearly see how effective first-contact resolutions contribute to revenue. In short, a strong FCR not only improves the customer experience but also drives growth and operational efficiency.
4. Message Delivery Rate
Message delivery rate refers to the percentage of messages that successfully reach your recipients' devices or inboxes out of the total you send. It’s the foundation of all messaging metrics - because if your messages don’t make it to the recipient, nothing else you measure matters. For SMS, you calculate this by dividing the number of delivered messages by the total sent, then multiplying by 100. The same principle applies to emails, push notifications, and in-app messages. This metric plays a crucial role in shaping customer interactions and ensuring smooth workflows.
Customer Experience Impact
When delivery rates drop, it’s not just a technical issue - it directly affects your customers. Missing password resets or order confirmations can frustrate users, leading to unnecessary support calls. Imagine a customer waiting for a shipping update that never arrives - they’re likely to reach out with a “Where is my order?” inquiry that could have been avoided. Worse, if a support team’s reply doesn’t reach the customer, it might make your brand seem unresponsive. For critical messages like appointment reminders or two-factor authentication, healthy delivery rates should be above 97%. Anything below that signals a problem that could erode trust in your brand.
Operational Efficiency
Delivery failures don’t just affect customers - they also create headaches for your support team. Every failed message can lead to duplicate tickets, longer resolution times, and inaccurate performance metrics. For instance, an agent might reply to a query, but if the message doesn’t go through, it could appear as though the conversation was unresolved. Real-time monitoring is key here. If you notice delivery issues tied to a specific carrier or campaign, addressing them quickly can prevent a surge in support volume.
Revenue Contribution
Delivery issues don’t just impact operations - they hit your bottom line. For promotional campaigns with purchase links, every undelivered message is a missed opportunity. Let’s break it down: if your campaign converts at 5% among delivered messages and has an average order value of $50, improving delivery rates from 90% to 97% on a 100,000-message campaign could result in 350 additional orders - adding up to about $17,500 in extra revenue. In transactional flows, undelivered messages can directly block purchases, leading to immediate revenue loss and even customer churn. By tracking conversion rates for successfully delivered messages, you can estimate how much revenue you’re leaving on the table due to delivery failures.
5. Engagement Rate
Engagement rate measures how many recipients actively interact with your message - whether by replying, clicking, or reacting. While delivery rate only confirms your message reached its destination, engagement rate dives deeper, showing if your content resonates enough to prompt action. It’s calculated as (engaged recipients ÷ delivered messages) × 100. For SMS and mobile communications, this often involves tracking response rates and click-through rates. Like response and resolution times, engagement rate is a key metric for gauging customer satisfaction and operational performance. It connects customer behavior to valuable business insights and potential revenue growth.
Customer Experience Impact
When customers engage quickly with your messages, it’s a strong sign you’re delivering content they find relevant. For two-way channels like support chats or confirmation messages, monitoring response speed can reveal how ready customers are to interact. On the flip side, low engagement paired with high opt-out rates might mean your messaging frequency or content isn’t hitting the mark. On the other hand, steady engagement alongside stable opt-out rates suggests your communication is fostering trust and meeting expectations.
Operational Efficiency
Engagement data does more than reflect customer behavior - it also helps fine-tune operations. For example, higher engagement, such as more replies or extended chat sessions, can indicate busier agents, potentially affecting response times. By analyzing engagement trends by time of day or week, businesses can identify peak activity periods and adjust staffing to align with customer demand. Tools like Inbox Agents (https://inboxagents.ai) use AI-powered smart replies to manage high-engagement queues, allowing agents to focus on more complex tasks.
Revenue Contribution
Engagement often serves as the first sign that a message will drive revenue. In marketing campaigns, high click-through rates on purchase links typically lead to better conversion rates and increased sales. As MessageMedia explains, CTR is "one of the top engagement metrics for SMS analytics in marketing" and "one of the best indicators of a good ROI." In support and sales-focused channels like live chat, engaged conversations that quickly resolve issues or guide customers through purchases often result in higher retention rates, successful upsells, and greater customer lifetime value. Real-time indicators - like a surge in clicks on "Complete Checkout" links or prompt responses to pricing questions - show how engagement directly translates into measurable business outcomes.
6. Response Rate
Response rate goes beyond engagement metrics to shed light on how well your messages spark two-way communication. It measures the percentage of delivered messages that receive a reply, calculated as: (unique replies ÷ delivered messages) × 100. Unlike click-through rate, which only tracks link clicks, response rate reflects genuine interaction, showing whether recipients are open to starting or continuing a conversation.
Customer Experience Impact
When customers respond to your messages, it’s a sign that your communication resonates and builds trust. Take, for example, a healthcare provider sending appointment reminders with clear instructions like, “Reply C to confirm, R to reschedule.” Such messages often see response rates exceeding 60–70%, indicating that patients find the communication helpful and timely. On the flip side, generic marketing messages with vague offers frequently struggle with single-digit response rates, which can lead to higher opt-out rates and diminished customer satisfaction. Monitoring response rates within specific timeframes - such as replies within 15 minutes, 1 hour, or 24 hours - can also reveal how promptly and enthusiastically customers engage.
Operational Efficiency
Response rate isn’t just about engagement - it directly influences operational planning. For instance, if you send 100,000 messages and anticipate a 10% response rate, you’re looking at 10,000 incoming conversations to manage. Real-time analytics can help predict queue lengths and adjust staffing to handle the workload efficiently, avoiding bottlenecks. High response rates for simple tasks, like “Reply Y to confirm delivery,” highlight opportunities for automation. This allows agents to focus on more complex interactions. Tools like Inbox Agents streamline this process by consolidating replies from SMS, chat, social media, and email into one platform. With AI-powered smart replies and automated summaries, agents can handle more conversations per hour without compromising quality.
Revenue Contribution
For sales and marketing teams, response rate is a valuable early indicator of potential revenue. Campaigns with higher response rates often lead to stronger click-through and conversion rates down the line, making this metric crucial for predicting ROI. In sales outreach, messages like “Reply to book a demo” that garner a strong response can significantly boost the number of qualified leads and meetings booked per 1,000 messages sent. Conversely, low response rates may signal the need to refine your targeting or messaging strategy. By tagging campaigns and comparing revenue generated from responders versus non-responders, businesses can pinpoint which efforts contribute the most to their bottom line, justifying further investment in high-response messaging.
Next, we’ll explore click-through rates to uncover which messages drive the most impactful customer actions.
sbb-itb-fd3217b
7. Click-Through Rate
Click-through rate (CTR) measures the percentage of delivered messages that result in a click on a tracked link. It's calculated using the formula: (unique clicks ÷ delivered messages) × 100. While response rate shows how many people reply, CTR dives deeper, revealing how effectively your message encourages further interaction. This metric is essential for understanding how well your communication drives customer actions.
Customer Experience Impact
CTR serves as a real-time indicator of how relevant your messages are. When customers click on links, it’s a sign that the content resonates with them. On the flip side, a sudden drop in CTR might signal technical issues or that the messaging isn’t hitting the mark. Pairing CTR with opt-out rates provides more context: a high CTR and low opt-outs suggest customers find your messages engaging and reliable. However, if high CTR is accompanied by rising unsubscribes, it could mean the messaging is too aggressive or confusing. Some platforms even track how quickly users click - whether it’s within 5 minutes, an hour, or a day - to gauge how timely and effective your communication is.
Operational Efficiency
When combined with response and engagement rates, CTR offers a well-rounded view of your messaging performance. Real-time CTR data allows businesses to adjust on the fly. For instance, if one message template consistently achieves higher CTR, it can be promoted, while less effective versions are paused. In conversational workflows, prioritizing quick-reply buttons or help articles with higher CTR can make interactions smoother for customers. A sudden dip in CTR can also alert teams to broken links or targeting mistakes. Tools like Inbox Agents bring all CTR data from SMS, email, chat, and social messaging into one dashboard. Using AI-driven insights, these platforms highlight the best-performing links and replies, helping teams optimize their strategies.
Revenue Contribution
CTR plays a key role in driving revenue through messaging campaigns. The typical flow looks like this: delivered messages → clicks (CTR) → on-site actions → conversions → revenue. Even a small CTR increase of 2–3 points can significantly boost revenue per 1,000 messages. To measure this impact, track how much revenue comes from sessions initiated through message links and calculate revenue per click. Comparing these numbers across different groups - like new versus returning customers or promotional versus service messages - can help fine-tune budget allocation. Real-time dashboards allow U.S. businesses to see same-day revenue trends and make adjustments to targeting or creative elements while campaigns are still running.
8. Conversion Rate and Revenue Impact
The conversion rate tells you how many recipients take a desired action after receiving your message. This could mean completing a purchase, booking an appointment, subscribing, or even replying with a specific keyword. The formula is simple: (conversions ÷ delivered messages) × 100. While metrics like click-through rate (CTR) show interest, the conversion rate digs deeper - it shows whether your messaging is actually driving results for your business. For U.S. companies, broad campaigns often see conversion rates between 1–5%. On the other hand, more focused efforts, like abandoned cart reminders or appointment confirmations, can hit 5–20% or more.
Customer Experience Impact
A high conversion rate often signals that your messages are hitting the mark - they’re timely, relevant, and solve real problems. For instance, a proactive shipping update or a personalized discount based on browsing history is more likely to resonate with recipients, leading to action. But focusing solely on conversions can be misleading. Keep an eye on opt-out rates too. If conversions are climbing but so are unsubscribes, your messaging might come across as too aggressive. Pairing conversion data with sentiment analysis and satisfaction scores offers a more complete picture, ensuring you're fostering trust and loyalty rather than just chasing quick wins.
Efficient conversion tracking not only improves the customer experience but also simplifies campaign management, making adjustments easier and more effective.
Operational Efficiency
Real-time tracking tools give teams the flexibility to optimize campaigns on the fly. If a particular template is driving conversions, you can promote it. If one is underperforming, pause it immediately. This dynamic approach helps maximize ROI throughout the day. Platforms like Inbox Agents make this even easier by consolidating multiple messaging channels - SMS, email, WhatsApp, social DMs, and live chat - into one dashboard. With AI-driven analytics, these tools identify high-value conversations and automate routine tasks, enabling teams to close more deals in less time. Metrics like closed conversations per agent hour and revenue per messaging seat clearly demonstrate how your team can generate more revenue without adding extra resources.
Revenue Contribution
To see the financial impact of your efforts, tie conversions directly to revenue. Start by calculating revenue per message (RPM) - divide the total revenue attributed to a campaign by the number of messages sent. Then, look at the average order value (AOV) for purchases driven by messaging compared to other channels. Many businesses find that SMS and messaging apps outperform email by a significant margin for time-sensitive offers, often delivering 2–5× higher conversion rates, thanks to open rates exceeding 90%. Real-time dashboards let you track same-day revenue trends and compare results across different customer segments, like new versus returning buyers or promotional versus service messages. To measure incremental revenue, compare a group that received messages with a control group that didn’t - the difference reveals the true net-new revenue generated by your campaigns.
9. Opt-In, Opt-Out, and List Health
Your opt-in and opt-out rates reveal how your audience feels about receiving your messages. The opt-in rate reflects how many people actively agree to receive your communications - whether through checkboxes, keyword responses like "JOIN", or double opt-in processes. On the flip side, the opt-out rate measures how many people leave your list after receiving messages, often by replying "STOP" or using unsubscribe links. Together with delivery rates, complaint flags, and engagement metrics, these signals form your list health - a snapshot of how interested and engaged your audience is, as well as how compliant your contact list remains. These metrics not only ensure you’re following regulations but also influence the quality of your interactions with customers.
Customer Experience Impact
A strong list begins with straightforward and transparent opt-in practices. When you set clear expectations about the type and frequency of messages, you build trust and reduce the likelihood of future opt-outs. On the other hand, making it hard for people to unsubscribe can backfire, leading to spam complaints and damaging your sender reputation. Monitoring opt-out rates in real-time can alert you to potential issues. For example, if opt-out rates spike above 1–2% after a campaign, it’s a warning sign that something - whether it’s the content, timing, or frequency - didn’t resonate. Pairing this data with sentiment analysis helps you dig deeper: Are people leaving because they’re annoyed, confused, or simply uninterested?
Operational Efficiency
Real-time tracking streamlines list management and minimizes compliance risks. Modern platforms automatically update subscription statuses as soon as someone opts out, eliminating the need for manual updates or batch processing. Tools like Inbox Agents take this a step further by syncing opt-out statuses across all channels instantly. For instance, if someone opts out via email, their status is updated across text, social media, and other communication platforms, ensuring no accidental messages slip through. AI-powered workflows can even recognize opt-out intentions expressed in everyday language - like “please stop texting me” - and handle them correctly without human intervention. This kind of efficiency not only saves time but also reduces errors, keeping your team focused and compliant.
Revenue Contribution
Maintaining a healthy list is crucial for maximizing your messaging ROI. A clean, engaged list leads to higher click-through and conversion rates, ultimately driving more revenue per message sent. To measure this, calculate revenue per active subscriber by dividing your campaign earnings by the number of engaged contacts. If this figure is rising, your list quality is on the upswing. If it’s falling despite a growing list, you might be adding unengaged contacts or overloading your audience with messages. Segmenting your list by engagement level can help refine your strategy. Highly engaged groups often deliver conversion rates 2–5× higher than average, so focusing on these segments ensures you’re protecting your most valuable revenue streams.
10. Sentiment and Quality of Experience
Sentiment analysis helps classify customer feelings - positive, neutral, or negative - in real time. Unlike traditional post-chat surveys that only scratch the surface, real-time sentiment scoring evaluates every single message as it happens. Tools like LivePerson's Meaningful Conversation Score combine these sentiment signals with outcomes to offer a live snapshot of customer satisfaction. This ongoing measurement paints a fuller picture of the quality of customer interactions and informs every part of the engagement process.
Customer Experience Impact
Two major factors that shape customer sentiment during messaging are speed and empathy. Research from Help Scout reveals that nearly one-third of negative satisfaction ratings stem from slow response or resolution times. Long waits or being passed between agents can quickly sour a customer’s mood. Real-time sentiment tracking addresses this by flagging issues as they arise. For instance, alerts can be triggered when sentiment takes a sudden dive or when specific keywords like "cancel" or "angry" are used. This allows supervisors to intervene in the moment.
Operational Efficiency
Sentiment data becomes even more impactful when paired with operational metrics like first contact resolution and average handling time. If a conversation shows both low sentiment and unresolved issues, it’s a clear signal for immediate action - whether that’s additional training or process tweaks. Tools like Inbox Agents can highlight frustrated messages instantly, enabling quick intervention. AI-powered smart replies also play a role by detecting negative sentiment and recommending more empathetic responses, helping agents defuse tense situations more effectively.
Revenue Contribution
Positive sentiment doesn’t just create happy customers - it often drives higher conversion rates and boosts customer lifetime value. By tracking metrics like average order value and conversion rates alongside sentiment, you’ll likely notice that positive interactions lead to significantly better outcomes. Customers who have a great messaging experience are also more likely to engage with future campaigns, click on offers, and accept upsell opportunities. On the flip side, a poor experience can lead to opt-outs and unsubscribes, shrinking your audience and hurting long-term revenue. Linking sentiment dashboards to churn and repurchase rates can provide the data needed to justify investments in improving customer interactions.
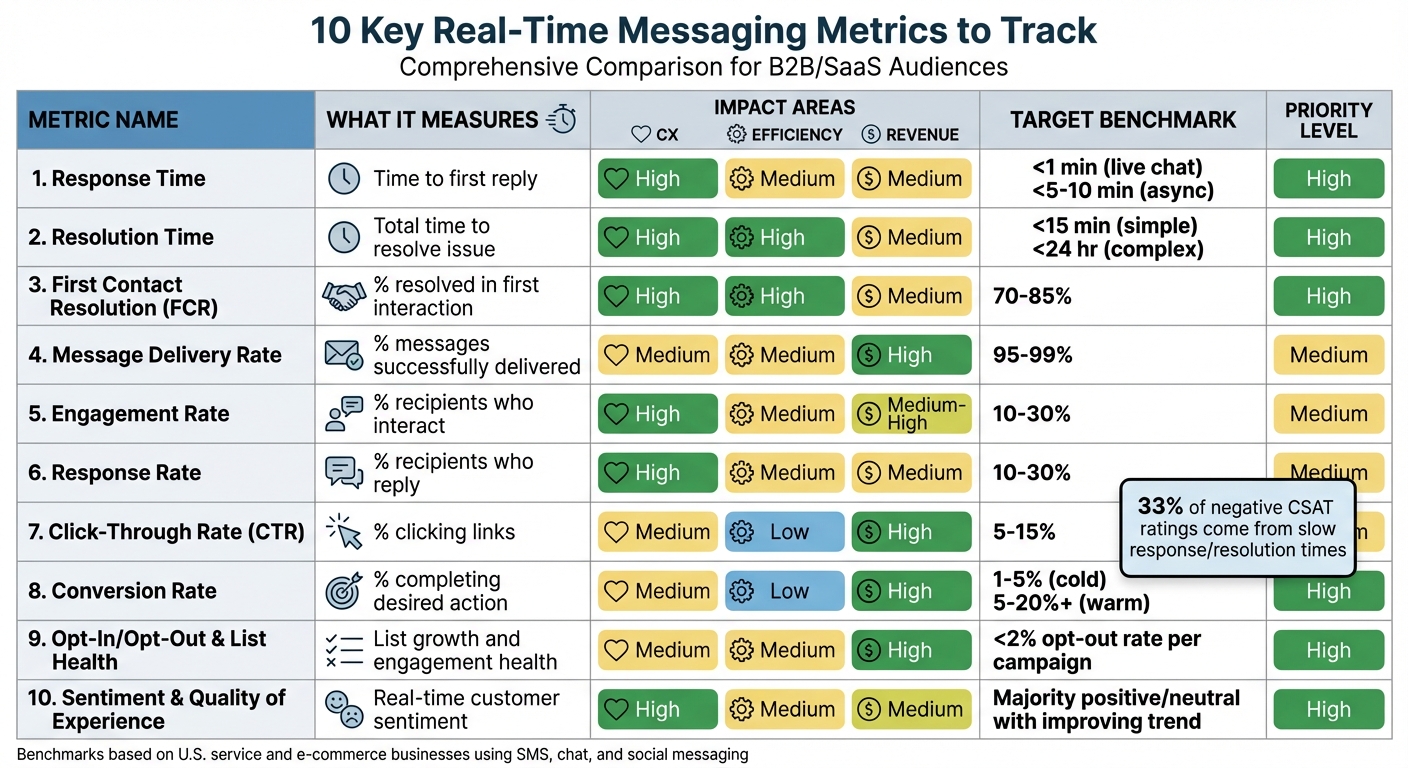
Metric Comparison Table
Here’s a quick overview of key real-time messaging metrics, their benchmarks, and actionable insights. Each metric is tied to customer experience, operational efficiency, and revenue impact. While these benchmarks are tailored for service and e-commerce businesses using SMS, chat, and social messaging, your specific industry - whether retail, healthcare, or professional services - might shift these targets slightly. After tracking your own performance for 60–90 days, adjust these benchmarks to better reflect your unique situation.
| Metric | What It Measures | Customer Experience Impact | Efficiency Impact | Revenue Impact | Target Benchmark (U.S.) | If Below Target |
|---|---|---|---|---|---|---|
| Response Time | Time taken to send the first reply after a customer message | High – Delayed responses often lead to dissatisfaction (Help Scout found about one-third of negative CSAT ratings stem from slow replies) | Medium – Faster replies may require better staffing or AI tools | Medium – Delays can disrupt sales conversations | < 1 min for live chat; < 5–10 min for asynchronous messaging | Add staff for peak hours or implement AI-assisted replies |
| Resolution Time | Time taken to fully resolve an issue from first message to closure | High – Quick resolutions are highly valued, while long back-and-forth exchanges frustrate customers | High – Shorter resolution times reduce cost per issue | Medium – Faster resolutions help retain customers and save at-risk sales | < 15 min for simple issues; < 24 hr for complex cases | Strengthen internal resources and automate repetitive issues |
| First Contact Resolution Rate | Percentage of issues resolved in the first interaction | High – Resolving issues in one go strongly correlates with high satisfaction | High – Reduces repeat contacts and overall handling time | Medium – Minimizing follow-ups supports retention and upselling | 70–85% | Analyze transcripts, train agents, and address common issues to streamline resolutions |
| Message Delivery Rate | Percentage of outbound messages successfully delivered to recipients | Medium – Failed messages mean missed confirmations and updates | Medium – A clean contact list minimizes wasted sends | High – Undelivered messages result in lost opportunities for clicks or conversions | 95–99% for SMS and push (with clean lists) | Validate lists, remove inactive numbers, and ensure compliance with carrier rules |
| Engagement Rate | Share of recipients who interact with your messages (e.g., reply, tap, or continue the conversation) | High – Interaction shows relevance and non-intrusiveness | Medium – Reflects improved targeting | Medium–High – Engaged recipients are more likely to convert | 10–30% for two-way SMS and messaging campaigns | Experiment with send times, refine copy, clarify calls-to-action, personalize content, and segment lists |
| Response Rate | Percentage of recipients who reply to your message | High – Two-way dialogue fosters a sense of being heard | Medium – Replies require agent time but indicate interest | Medium – Higher response rates lead to more conversion opportunities | 10–30% for SMS surveys and two-way campaigns | Improve timing, simplify calls-to-action, and streamline reply processes |
| Click-Through Rate (CTR) | Percentage of recipients clicking a link in your message | Medium – Clicks indicate interest but not necessarily satisfaction | Low – Primarily a campaign performance metric | High – Often cited as a key indicator of SMS marketing ROI | 5–15% for well-targeted SMS and push campaigns | Clarify offers, optimize landing pages, and align messaging with site content |
| Conversion Rate | Percentage of recipients completing a desired action (purchase, booking, signup) after receiving your message | Medium – Conversions reflect relevance but not service quality | Low – Primarily measures marketing impact | High – Tracks revenue generated per message | 1–5% for cold campaigns; 5–20%+ for warm or transactional follow-ups | Test offers, personalize messages, and minimize friction in the process |
| Opt-In, Opt-Out & List Health | Growth, decline, and engagement health of your contact list | Medium – High opt-out rates may signal poor messaging or fatigue | Medium – A healthy list reduces wasted effort | High – Shrinking lists harm long-term revenue and trust | Opt-out rate < 2% per campaign; steady or growing opt-in rate | Lower message frequency, set clear opt-in expectations, and improve content relevance |
| Sentiment & Quality of Experience | Real-time customer sentiment during interactions | High – Directly reflects how customers view your brand | Medium – Negative sentiment can lead to repeat contacts or escalations | Medium–High – Positive sentiment builds loyalty and repeat business | Majority positive or neutral with an improving trend | Review transcripts, train agents, adjust tone, and use follow-up surveys to identify issues |
For better tracking and performance, consider tools like Inbox Agents to monitor these metrics effectively.
Conclusion
These ten metrics collectively offer a clear and comprehensive view of how well your messaging strategy is performing. Metrics like response time, resolution time, and first contact resolution are directly tied to customer satisfaction. For instance, Help Scout found that about one-third of negative CSAT ratings result from slow replies and prolonged issue resolution. Meanwhile, metrics such as delivery rate, engagement rate, response rate, click-through rate, and conversion rate help turn customer interactions into revenue. On the other hand, opt-in, opt-out, and list health safeguard your audience's engagement and the return on your investment. Lastly, sentiment and quality of experience act as an early-warning system, providing insight into customer attitudes before problems grow.
The real advantage lies in tracking these metrics in real time, not just through periodic reports. If delivery rates dip or response times increase, you can make immediate adjustments - whether it’s reallocating staff or tweaking your messaging - before inefficiencies spiral out of control. Take, for example, a retail brand that increased its message delivery rate from 92% to 97% and improved its click-through rate from 4% to 5.5% by cleaning its contact list and testing new CTAs. This adjustment reached an additional 5,000 people and generated 1,500 more link clicks during a 100,000-contact campaign. With an 8% conversion rate and an average order value of $75.00, the change resulted in an extra $9,000–$10,000 in revenue, not including the potential for repeat purchases. Additionally, making quick changes to staffing and campaign strategies can lower operating costs by reducing redundant customer interactions and improving resource allocation.
Tools like Inbox Agents simplify this process by consolidating SMS, email, social DMs, and chat into a single platform. Instead of juggling multiple reports, you can access one dashboard that tracks delivery, engagement, sentiment, and conversions across all channels. AI-powered summaries flag important KPI changes, while features like smart replies and negotiation handling ensure high first-contact resolution rates and faster responses. The Dollarbox feature even pinpoints messages with revenue potential, so you never miss a chance to drive sales.
Start small by focusing on three or four core metrics - such as median response time, resolution time, delivery rate, and conversion rate - and establish benchmarks over two to four weeks. Set achievable goals, like reducing your median first response time from three minutes to 90 seconds. Experiment with message timing and CTAs, then monitor how engagement, click-through rates, and conversions shift. Real-time analytics allow you to fine-tune your strategy on the fly, turning every interaction into a measurable and improvable opportunity. By aligning your metrics with actionable insights, you create a messaging strategy that not only enhances customer satisfaction but also drives meaningful revenue growth.
FAQs
How does real-time messaging analytics help improve customer satisfaction?
Real-time messaging analytics gives businesses the ability to elevate customer satisfaction by providing immediate insights into critical metrics like response times, engagement levels, and sentiment. These metrics empower teams to act swiftly, handle customer concerns more effectively, and deliver interactions that feel tailored to individual needs.
Using tools that bring multiple messaging platforms together in a single interface, businesses can simplify communication, cut down on delays, and ensure customers feel heard and appreciated. This method not only speeds up issue resolution but also strengthens the bond between businesses and their customers.
Why is it important to monitor message delivery rates?
Keeping an eye on message delivery rates is key to ensuring your messages actually make it to their intended recipients. A high delivery rate means your communications aren’t getting lost, blocked, or flagged - an important factor in keeping interactions smooth and effective.
When businesses track this metric, they can quickly spot and fix delivery problems, fine-tune their messaging strategies, and stay connected with their audience. This doesn’t just improve communication; it also opens doors to stronger engagement and better customer relationships.
What is sentiment analysis, and how does it improve customer interactions?
Sentiment analysis involves pinpointing and interpreting the emotions expressed in customer messages. By understanding the tone - whether it's frustration, joy, or something in between - businesses can tailor their responses to align with the customer's emotional state. This might mean showing empathy when addressing a concern or sharing in a customer's excitement over positive feedback.
Using this approach, companies can boost engagement, resolve problems more efficiently, and strengthen their connections with customers. The result? Happier customers and greater loyalty.